


What is Technographic Data? The Ultimate Guide to Tech-Driven Market Intelligence
Most GTM teams do not have a pipeline problem; they have a data visibility problem. A generic ICP with industry, company size, maybe revenue band, and a vague job title or two won't build a quality lead pipeline for an enterprise brand.
Today, buyers are always on the move. Stacks change monthly, and the intent is visible even before the form fills. To win, modern GTM strategies require a deeper layer of intelligence. This is where technographics and a trusted technographic data provider become essential.
Summary
- Concept: Technographic data identifies the exact software and hardware infrastructure your target accounts currently use.
- Problem: Relying solely on basic company details (firmographics) leads to wasted marketing spend and blind sales calls. It tells you who the company is, but not how they operate.
- Impact: Using technographic segmentation lowers Customer Acquisition Cost (CAC) by enabling GTM teams to target only companies with compatible tech stacks, run precise competitor-displacement campaigns, and engage buyers exactly when they are ready to upgrade.
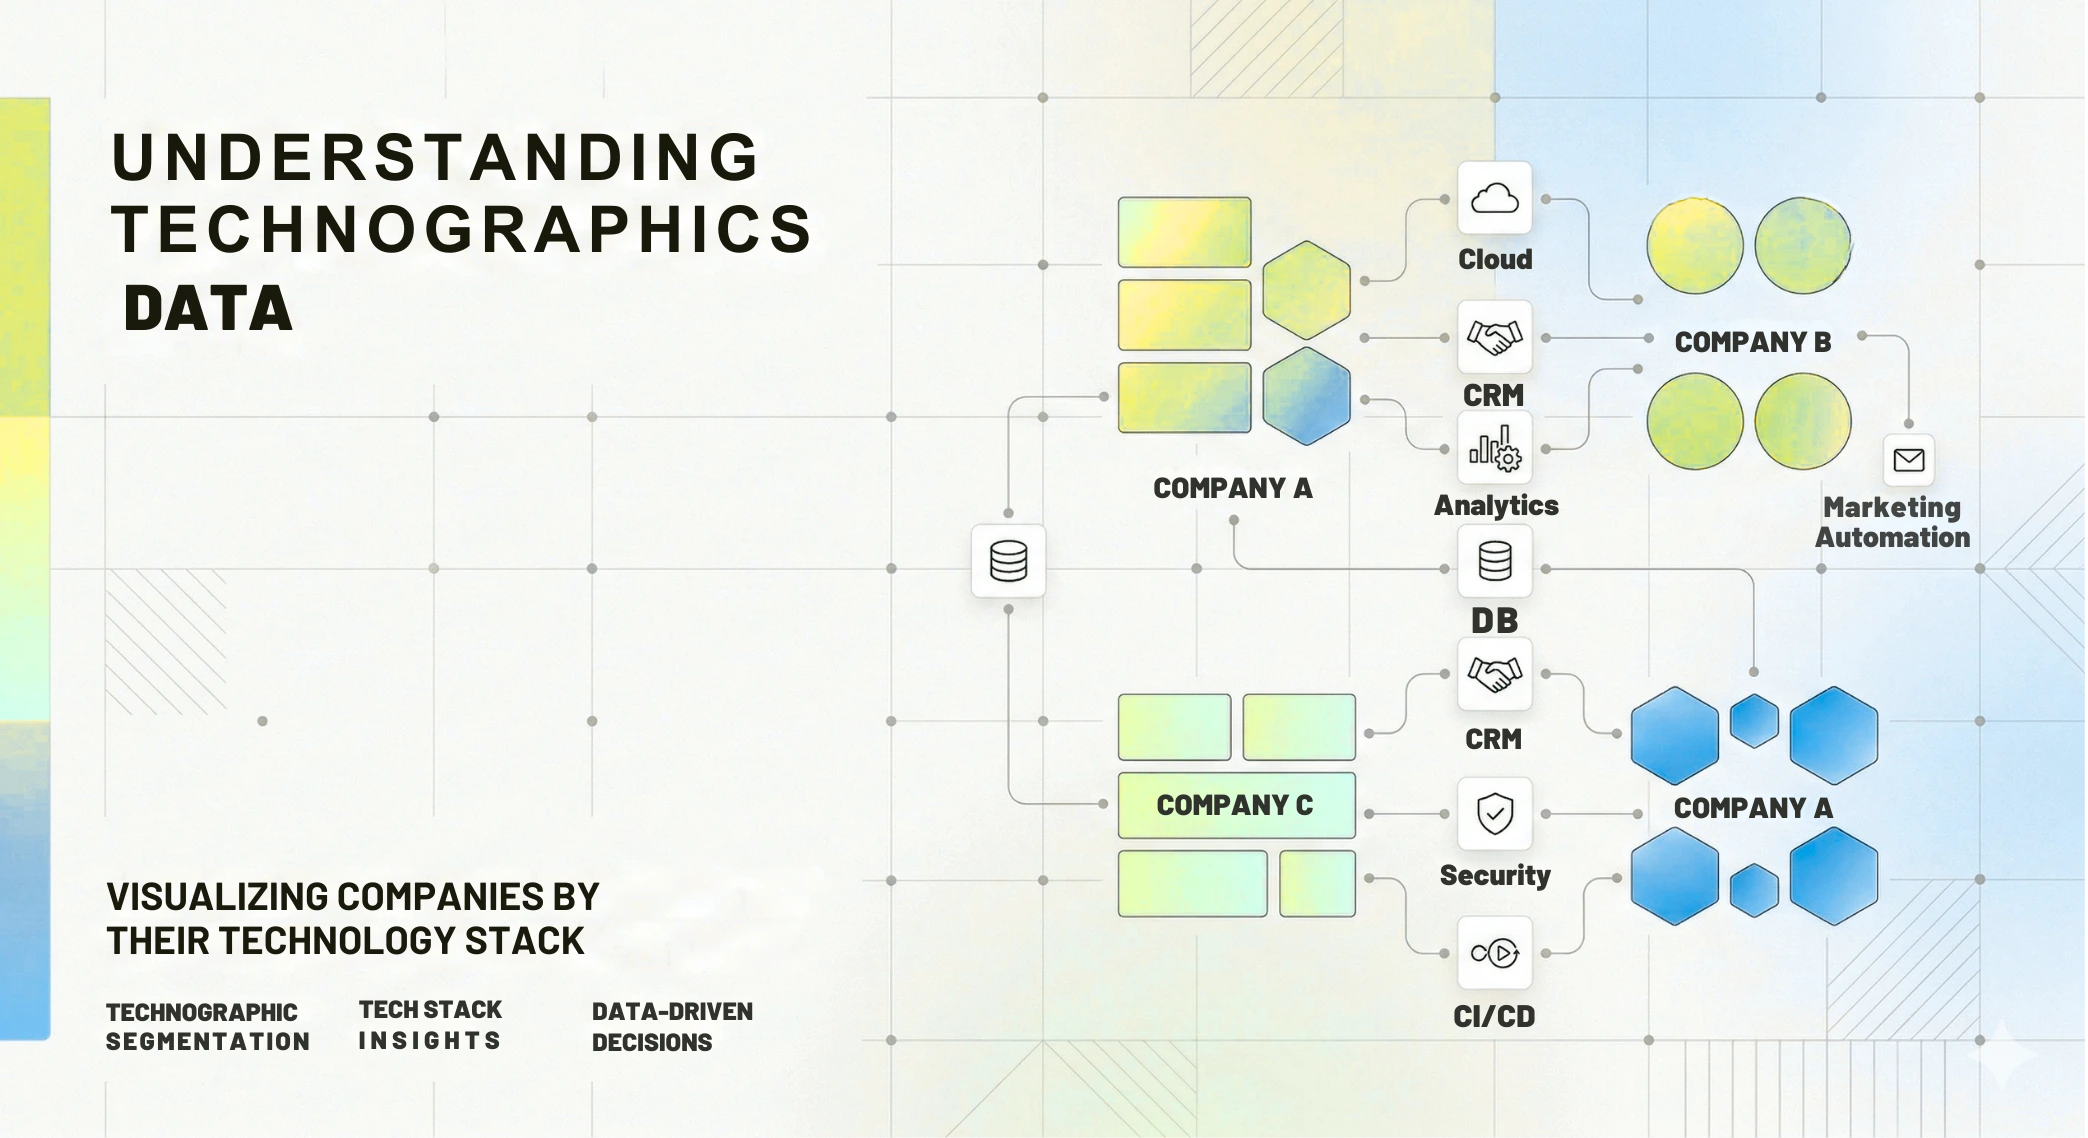
What are Technographics?
Technographics are detailed insights into a company's technology stack. With technographics, you'll know what tools your target prospects are using, how mature their setup is, and where the gaps are.
This includes data like:
- CRM, MAP, CDP, and data tools in use
- Cloud, security, analytics, and collaboration platforms
- Adoption dates, usage patterns, and integration footprints
Why this matters for ICP and personas:
- You can spot buyers running a competitor and time "rip-and-replace" campaigns around renewal or expansion.
- You can prioritise accounts whose stack plays nicely with your product (integration-led selling).
- You can tailor your narrative to their exact environment: legacy migration, consolidation, cost-cutting, or modernisation.
In other words: technographics turn "Head of Ops at a mid-market SaaS" into "Head of Ops at a mid-market SaaS, running Tool X + Tool Y, hitting specific integration and reporting walls that our product solves."
How is Technographics Data Different?
While firmographics outline the basic shape of a company (like size, location, and industry) and contact data simply gives you a name, they fail to reveal the company's daily operational reality. Technographics bridge this gap by showing you exactly how a business functions.
It's not just another list of facts. It is the strategic foundation of a modern GTM strategy. Here is how technographics complete the B2B customer database:
The 4 Layers of Modern B2B Market Intelligence
| Data Layer | What It Tells You About the Prospect | Example |
|---|---|---|
| Firmographics | Size, revenue, industry, sector, geographic location, ownership, and growth trends. | Mid-market FinTech, 450 Employees, New York HQ, $80M ARR. |
| Contact Data | Who the decision-makers are. | VP of Revenue Operations. |
| Technographics | Tech stack composition, adoption and usage patterns, competitors' intelligence, purchasing propensity, and operational maturity. | Website on WordPress; uses Drift (chat) and Salesforce (CRM). Recently adopted HubSpot (Marketing) in Q1; renewal in 90 days. |
| Intent Data | When they are ready to buy. | Actively researching "Marketo alternatives" and "Hubspot vs. Salesforce integration." |
Isolated data points only tell a fraction of the story. The true power of B2B intelligence is unlocked when these layers intersect:
Firmographics + Contact Data + Technographics + Intent Data = Dynamic, Data-Driven Personas.
This formula transforms a static list of companies into a living playbook, revealing exactly who to target, how their business operates, and precisely when they are ready to buy.
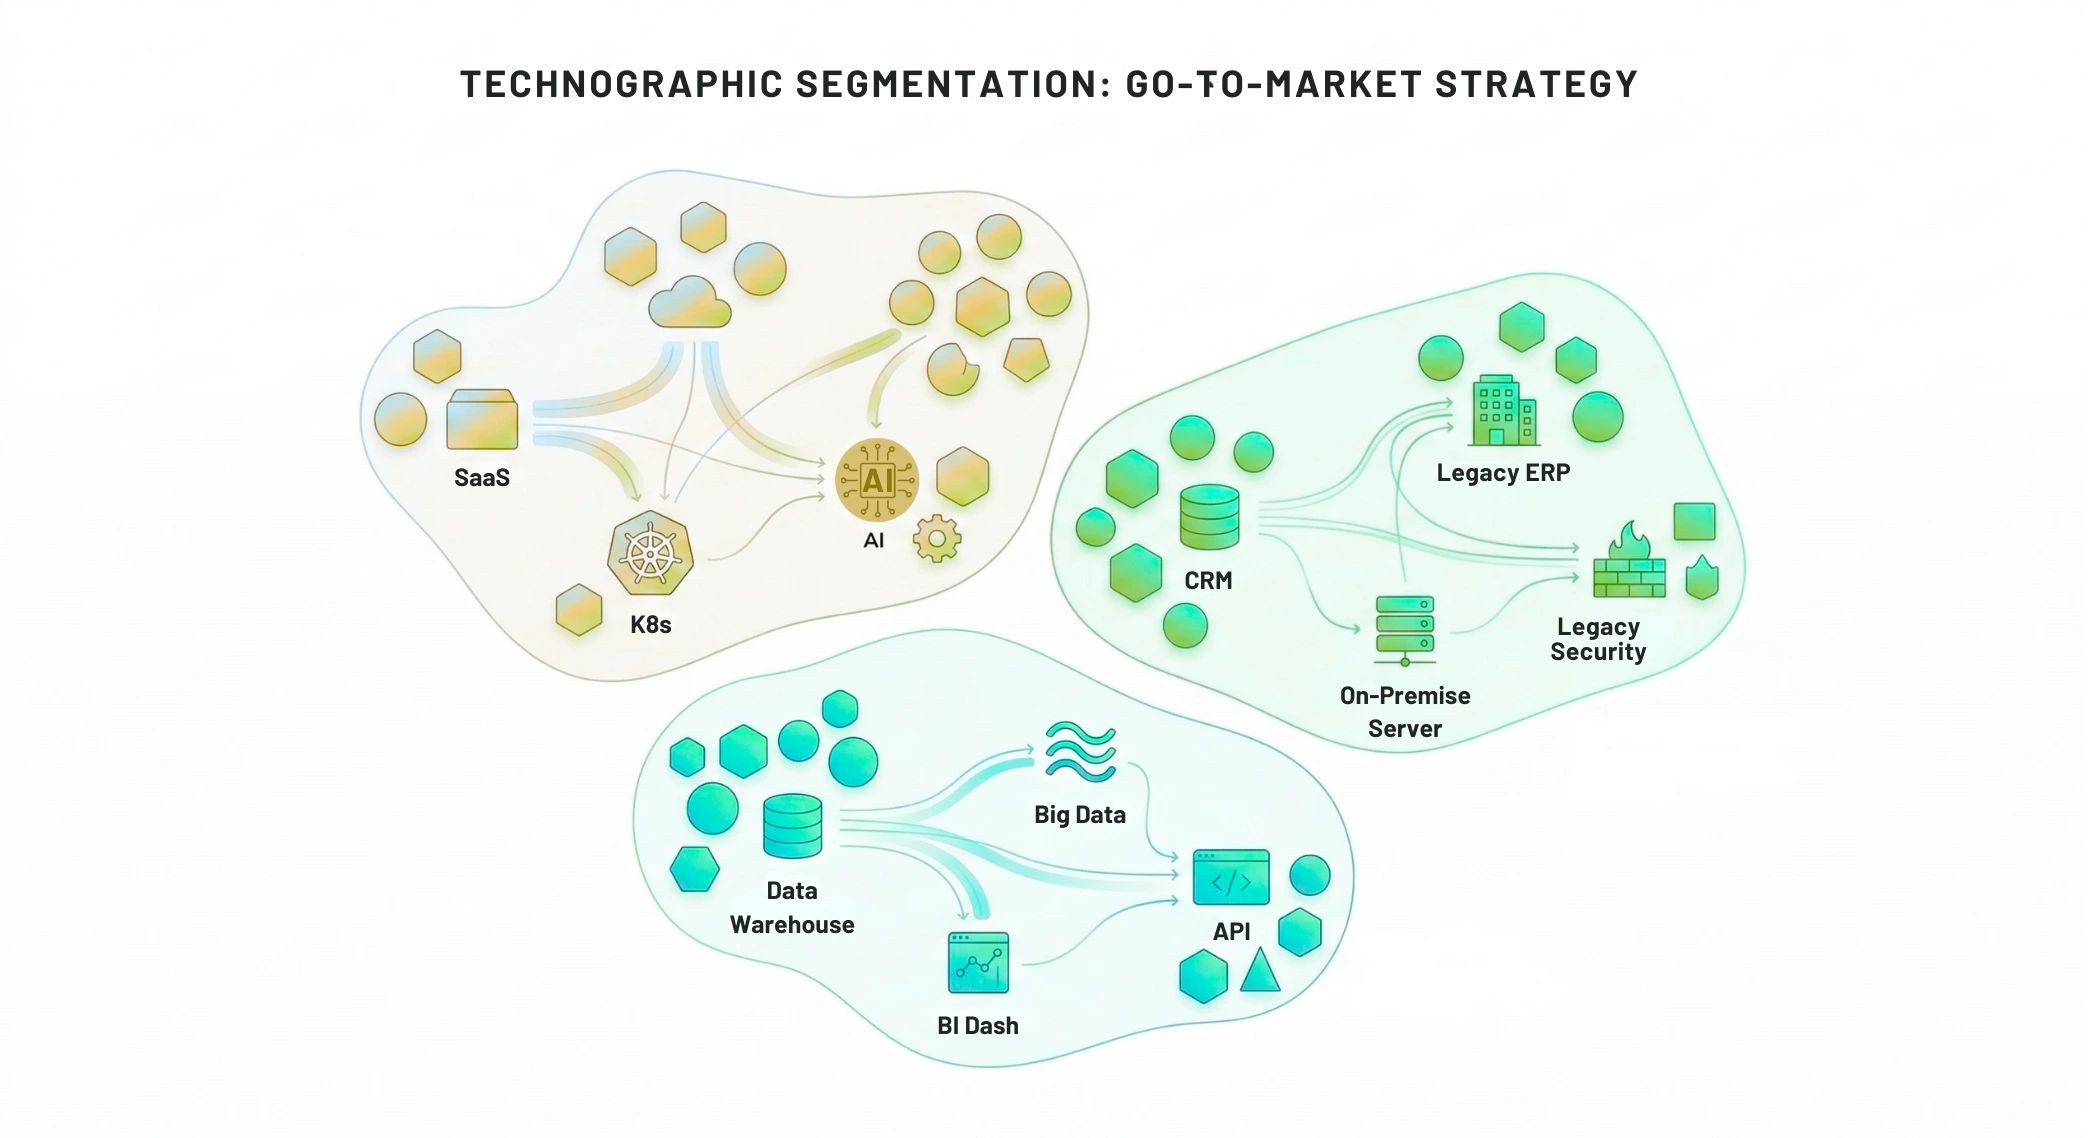
What is Technographic Segmentation?
Technographic segmentation is the process of dividing your TAM based on a company's hardware and software environment, rather than just their revenue or headcount.
By segmenting audiences by their tech stack, you can use highly specific marketing and sales strategies. Key strategies include:
- Competitive Segmentation: Grouping accounts that currently use your direct competitors. This allows you to run targeted "rip-and-replace" or "switch and save" campaigns timed perfectly around their software renewal dates. It's a strategy many B2B companies use to capture competitor customers faster.
- Integration and Complementary Segmentation: Grouping accounts that use software your product integrates with seamlessly. You can pitch your product as the missing piece that adds value to their current stack.
- Maturity Segmentation: Separating companies that are "Cloud Native" (fast movers) from those stuck on "Legacy On-Premise" systems (needing heavy modernisation).
What are the Different Ways GTM Leaders Can Use Technographics to Drive Revenue?
Top-performing executives do not just buy data; they build automated plays around it. Here are four exact playbooks revenue leaders use to turn tech stack insights into pipeline.
Playbook 1: Precision Account-Based Marketing (ABM)
Marketing teams use tech stacks to personalise ad copy and messaging. Instead of a generic "improve your analytics" ad, you can target specific accounts with messaging like, "Make your Salesforce and Snowflake data work together." This dramatically lowers ad spend waste.
Playbook 2: Frictionless Sales Discovery
Sales cycles drag on when reps spend the first 20 minutes of a call asking basic qualification questions. With technographic data enriched through a technology append, reps walk into a call already knowing the prospect's existing tech stack and integration environment.
They don't have to waste much time on a generic discovery phase. Just discuss the pain point and provide valuable solutions.
Playbook 3: Partner & Channel Expansion
If you know which companies are using your competitor's software, you can also identify the agencies and IT consultants who implemented it. You can then recruit those specific MSP channel partners to sell your solution instead.
Playbook 4: Product Roadmap Alignment
Product teams use macro-technographic data to decide what to build next. By analysing the most widely adopted tools in your target market, your engineers know exactly which software integrations will drive the most value.
Who Uses Technographic Data? (Key Industries and Target Tech Stacks)
While any B2B organisation benefits from better intelligence, technographics are a mandatory growth lever for companies selling complex, high-ticket solutions.
GTM teams use tech-stack data to trigger highly specific displacement and integration plays. Here is how priority industries target specific infrastructure tools:
| Strategic Play | Target Industries | High-Value Tech Targets | The Conversion Trigger |
|---|---|---|---|
| Enterprise App Consolidation | ERP & SCM, Enterprise Applications, Software Vendors | SAP ECC, MS Dynamics GP, OneStream, Dayforce | Modernising slow, disconnected supply chains and timing forced cloud migration deadlines. |
| Infrastructure & Cloud Modernisation | Cloud Companies, IT Hardware, IT Service Providers | VMware, Juniper Networks | Mapping on-premise to cloud migration timelines and identifying hardware refresh cycles. |
| Security & Threat Defense | Cybersecurity Software | Wiz, Microsoft Defender | Replacing outdated legacy defense stacks or pitching complementary security integrations. |
| Data Maturity & Analytics | SaaS, Vertical Software, BI & Data Analytics | Confluent, Informatica | Consolidating fragmented reporting tools and identifying heavy data users needing scalable storage. |
How is Technographic Data Collected? (And Why Most of It Fails)
Many standard data providers collect information using automated web scraping or basic email surveys. This creates a massive problem: Data Decay.
When GTM teams rely on raw, automated data, reps end up pitching the wrong solutions to companies that aren't actually using the target technology. Here is how the industry standard fails, and why verification is non-negotiable.
1. Automated Web Scraping & Site Parsing
The Industry Standard: Bots crawl company websites looking for technology signatures hidden in the source code (such as a Marketo or HubSpot tracking pixel).
The Flaw (False Positives): Code lingers. A company might have tested a competitor's software during a 14-day free trial four years ago and accidentally left the tracking pixel on their site. Automated scrapers will still flag that company as an active user today. As a result, your sales reps waste hours crafting a highly specific displacement pitch for a tool the prospect hasn't touched in years.
2. Natural Language Processing (NLP) on Job Boards
The Industry Standard: Algorithms scan public job postings to see if a company is actively hiring for specific roles, such as "Salesforce Administrators" or "AWS Cloud Architects."
The Flaw (Aspiration vs. Reality): A job posting indicates the intention to use a tool, not that the software is successfully deployed, integrated, and currently consuming budget. Relying solely on this signal often causes reps to engage 6 to 12 months too early, right in the middle of a chaotic implementation phase where the buyer is not ready to evaluate supplementary tools.
3. Co-op Data Networks & API Sharing
The Industry Standard: Data vendors pool together user lists from various third-party apps and networks to create massive, aggregated databases.
The Flaw (Stale Aggregation): When data is passed through multiple third parties, it loses its timestamp and context. You have no way of knowing if the company adopted the technology yesterday or five years ago, making it impossible to accurately time a contract renewal or "rip-and-replace" campaign.
How DCM's Hybrid Verification Model Stands Out?
In enterprise sales, a million unverified records is a liability, not an asset. Demand Curve Marketing eliminates data decay by moving beyond automated generic lists.
We operate on a sophisticated Hybrid Verification Model:
- Technological Speed: Our AI-driven systems aggregate real-time market signals and technology footprints.
- Human Precision: Our research experts perform Human-in-the-Loop Verification on high-value data points to ensure absolute accuracy.
- Continuous Updates: The database is put through strict 30, 60, and 90-day refresh cycles to guarantee freshness.
The Result: Your sales team spends 100% of their time engaging with verified, high-fit prospects, protecting your domain's sender reputation and dramatically shortening your sales cycles.
Want to Upgrade Your GTM strategy with Technographics Data?
Accelerate revenue using 97% accurate, human-verified intelligence from DCM's database of 30,000+ technology vendors.
How to Get Started with High-Accuracy Technographics?
Transitioning to a tech-driven market strategy does not require overhauling your entire operation overnight. Start by enriching your top target accounts with high-fidelity technographics to spot integration gaps and displacement opportunities instantly.
Relying on generic, unverified lists is costing your team's pipeline. By partnering with Demand Curve Marketing, you secure a competitive advantage built on accuracy.
Ready to see the difference human-verified data makes? Let's connect.
FAQs
1. What is technographic data?
Technographic data reveals the technologies companies use, such as CRM systems, marketing automation platforms, analytics tools, and hosting infrastructure. It helps businesses understand a prospect's tech stack and make smarter GTM, sales, and marketing decisions.
2. What are DemandCurve Marketing's technographic data sources?
DemandCurve Marketing gathers technographic insights from multiple verified sources, including web technology detection, public datasets, partner data providers, digital footprint analysis, and AI-powered enrichment models to maintain accuracy and coverage.
3. Why is technographic data important for B2B sales?
Technographic data helps sales teams identify prospects already using relevant tools or competitor solutions. This enables more personalised outreach, stronger positioning, and higher conversion rates.
4. What industries benefit most from technographic data?
Technographic insights are especially valuable for SaaS companies, MarTech providers, cybersecurity vendors, cloud platforms, and B2B technology businesses that sell products integrating with other software.
5. Who uses technographic data?
Technographic insights are widely used across revenue and growth teams:
- Sales teams to prioritise accounts likely to buy
- Marketing teams for targeted campaigns and segmentation
- Revenue Operations teams to refine GTM strategy
- Product teams to understand ecosystem integrations
- Partnership teams to identify integration opportunities
6. How reliable and secure is DCM's technographic data?
We refresh our technographic dataset every 45 days to capture new tool adoption and changes in company tech stacks. Our automated detection, combined with human-in-the-loop validation, helps maintain high accuracy while compliant data sources ensure strong security and governance standards.
About us
DemandCurveMarketing (DCM) is your dedicated B2B technology growth partner. Our handpicked team of expert technology marketers empowers IT and tech-driven companies to accelerate growth through data-driven strategies and unparalleled market intelligence. We specialize in delivering hyper-targeted audience insights, advanced technographics, precise channel and industry targeting, and comprehensive data enrichment and cleansing solutions—all in one place.
With intelligence on 30,000+ vendors spanning software, hardware, cloud, networking, and emerging tech, DCM helps you deeply understand your Total Addressable Market (TAM), identify high-fit opportunities, and align your outreach and campaigns for optimal impact. Our solutions support companies of all sizes, from ambitious startups to Fortune 500 leaders, ensuring that each client has access to reliable, current, and actionable data for a competitive advantage.
Subscribe to our Technology Marketing Hacks newsletter for tailored insights and growth strategies.
Contact us for any tech or marketing queries: sales@demandcurvemarketing.com
Read our previous newsletter - Webinar & Event Outreach for B2B Tech Companies — How to Fill Seats with Your Ideal Attendees